I had to skip week 6 about Kafka since it needed a lot of time and because I was not going to use it in…

Stories about going beyond information.
I had to skip week 6 about Kafka since it needed a lot of time and because I was not going to use it in…
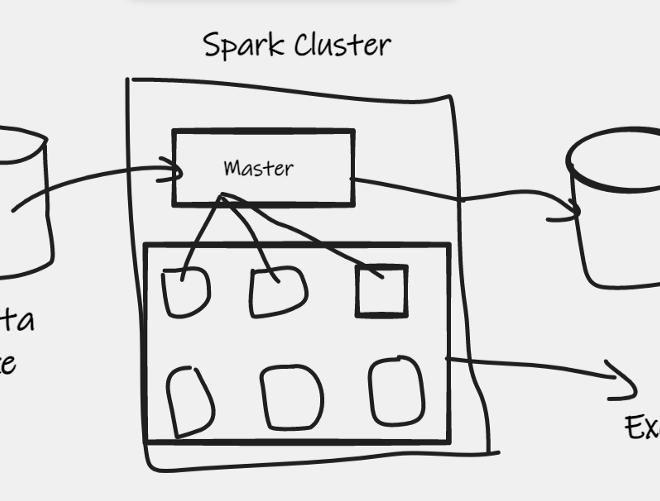
This week’s lesson was weird since I, like other people who have not yet had data greater than a TB to work with, don’t understand…

Following week 3 I had a lot of question about how you build Applications and Visualizations on top of BigQuery. With DBT the whole process…
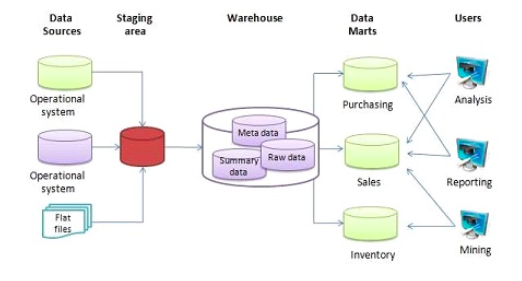
Week 3 was about data warehousing, working on the data that was ingested in the week 2. We will take the already ingested data and…

Following last weeks blog, we move to data ingestion. We already had a script that downloaded a csv file, processed the data and pushed the…
In recent times there has been a surge in animated bar graphs visualization. They are mainly used to show how certain events changed overtime. At…
The past week the data team was tasked with visualizing map statistics over a map. This seems easy for anyone who has used D3.js, but…
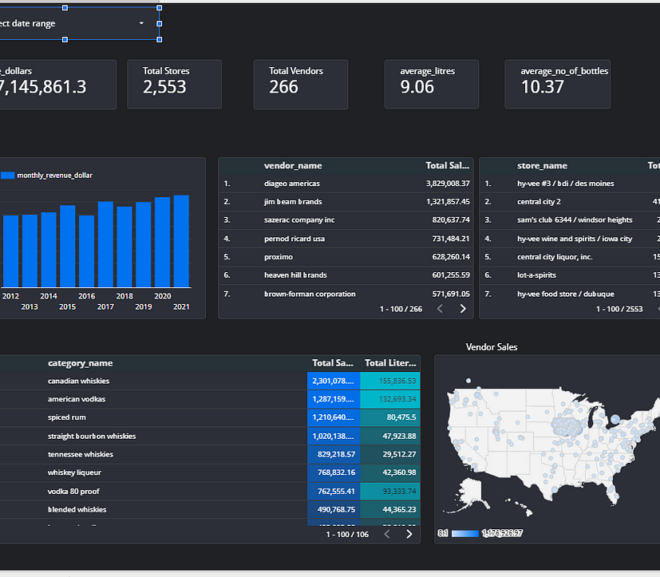
Last week I had 3 days to come up with a visualization dashboard. My backend choice was flask (we are inseparable) however I had to…
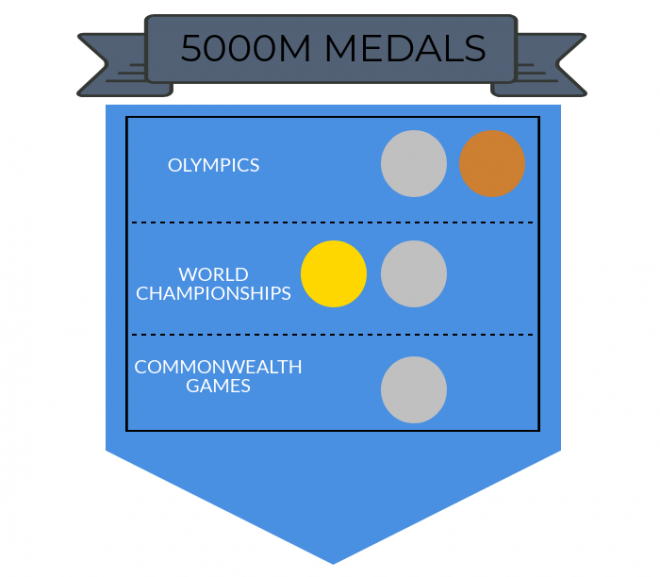
Eliud Kipchoge was born on the 5th of November 1984 in Kapsisiywa, Nandi District, Kenya. He rose to fame in 2003, when he won the…

Every marathon fan and stakeholder cannot wait for the athletes to break 2-hour barrier. The closest they have come is Eliud Kipchoge’s 2:00:25 in Monza.…